The Chromatogram: A Colorful Story
Chromatography literally means “writing with color.” The term comes from the Greek words chroma, for color, and graphein, for writing. The technique was first described in the early 1900s by the Italian botanist Mikhail Tsvet. He separated plant pigments by passing extracts through a column packed with many stationary phases such as calcium carbonate. As the pigments moved through the column, they formed colored bands (visible to the naked eye). That visual separation was, in a very real sense, the first chromatogram.
In those early days, the chromatogram was something you looked at directly. The separation produced visible bands on a column or later on paper. Paper chromatography and thin-layer chromatography continued this approach. You could see the spots. Your eye was the detector.
As chromatography evolved, especially with the development of gas chromatography and later liquid chromatography, we began separating colorless compounds at very low concentrations. High-performance liquid chromatography, and now ultra-high-performance liquid chromatography, made it possible to separate complex mixtures with high resolution and speed.
With these advancements came electronic detectors. Instead of seeing colored bands, we now record an electrical signal over time. That signal is plotted as a chromatogram. The baseline represents the system with no analyte present. When a compound elutes and reaches the detector, the signal increases and forms a peak.
Today, in liquid chromatography in particular, the chromatogram is the central output. It is how we interpret separation performance, quantify compounds, and assess the health of the system.
What a Chromatogram Really Shows
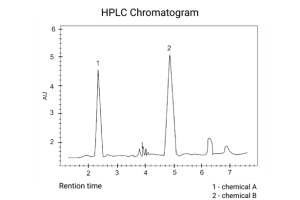
In simple terms, a chromatogram is a graph of the detector’s signal as it changes over time.
You begin with a baseline. This reflects the detector response to the mobile phase alone. When an analyte elutes from the column, the detector responds, and the signal rises. That rise forms a peak.
If everything is working well, that peak has a smooth, symmetrical shape. In theory, the ideal peak resembles a Gaussian distribution. As molecules travel through a packed column, they follow slightly different paths. Some move a bit faster, some a bit slower. The statistical distribution of those many small differences produces the familiar bell-shaped curve.
The retention time tells you when the compound eluted. The area under the peak is generally proportional to the amount of compound present – depending on the detector one is using.
In liquid chromatography, this shape is influenced by, but not limited to, particle morphology and size, packing technology, pore structure, surface chemistry, flow rate, temperature, and system dispersion. The chromatogram is therefore a combined reflection of column design, instrument performance, and method conditions.
Why Good Peaks Are Formed
A good peak is typically:
- Symmetrical
- Narrow
- Well resolved from neighboring peaks
- Free of shoulders, splits, or distortion

Good peaks form when interactions between the analyte and the stationary phase are balanced and consistent.
Chromatography depends on interaction. In reversed-phase liquid chromatography, for example, analytes partition between the mobile phase and a hydrophobic stationary phase. In other modes, such as ion exchange or size exclusion, different mechanisms dominate. Regardless of the mode, the key is that interactions must be strong enough to create separation but fast and reversible enough to maintain band integrity.
When stationary phase chemistry is well controlled, particle morphology is uniform, and the packed bed is homogeneous, mass transfer between phases is efficient. The analyte band remains tight as it moves through the column. When it reaches the detector, it produces a clean, symmetrical peak.
This is where column design and manufacturing quality matter. Modern silica technology, surface modification, and bonding chemistry all contribute to peak shape. For example, advanced reversed-phase columns such as those in the YMC Triart or YMC-Pack series are engineered for high mechanical strength and carefully controlled surface chemistry. Low levels of residual silanols, robust bonding, and optimized pore structures help reduce secondary interactions and support consistent mass transfer.
In practical terms, that translates to sharper peaks, better symmetry, and improved reproducibility across batches and instruments.
Why Bad Peaks Are Formed
When peaks are distorted, this indicates that the balance has shifted.
Fronting occurs when a peak is broader at the leading edge. In liquid chromatography, this is often caused by column overloading. If too much analyte is injected, the stationary phase can become partially saturated. The front of the band experiences different conditions than the rest, and the peak shape reflects that imbalance.

Tailing is characterized by an extended trailing edge. In silica-based columns, tailing is frequently linked to secondary interactions with residual silanol groups or metal sites. Basic compounds are especially prone to this effect. If a fraction of the analyte population interacts more strongly or more slowly than the rest, those molecules elute later and stretch the back of the peak.

Broad peaks indicate reduced efficiency. Causes can include poor packing quality, voids at the column inlet, extra column volume in the system, inappropriate flow rate, or degraded stationary phase. Any factor that increases band dispersion or slows mass transfer will widen the peak.
Split peaks may point to injection issues, incomplete sample dissolution, or physical defects at the head of the column. In gradient liquid chromatography, mismatches in solvent strength between the sample and the initial mobile phase can also distort peak shape.
In extreme cases, peaks may disappear altogether. If the interaction between the analyte and the stationary phase is too strong under the chosen conditions, the compound may not elute. In other cases, irreversible adsorption can occur, particularly with highly reactive or strongly binding species.

High-quality column design can mitigate many of these problems. Consistent particle size distribution, stable bonding chemistry, and rigorous quality control help reduce active sites and minimize unpredictable interactions. For laboratories running demanding applications such as peptide separations, chiral analysis, or impurity profiling, these details directly impact peak shape and resolution.
The Chromatogram as a Diagnostic Tool
For engineers and scientists, the chromatogram is more than a picture. It is a diagnostic readout of the entire system.
Changes in retention time can indicate shifts in mobile phase composition, flow rate, or temperature. Increasing tailing may signal column aging or contamination. Loss of efficiency may point to system dispersion or plumbing issues. Irregular peak shapes can reveal problems with sample preparation or injection technique.
In liquid chromatography, especially, the chromatogram reflects the interaction of chemistry, materials science, and fluid dynamics. Particle morphology, pore size distribution, surface coverage, and bonding stability all influence the final signal. So do pump performance, mixer design, and detector response.
When a column consistently produces symmetrical, narrow peaks under appropriate conditions, it suggests that the stationary-phase chemistry is well matched to the analyte and that the packed-bed structure is sound. When peak shape begins to degrade, the chromatogram often provides the first indication.
From Colored Bands to Engineered Performance
Chromatography began with visible colored bands moving through a glass column. Today, it is a digitally recorded signal generated by highly engineered liquid chromatography systems.
Yet the core principle stands. We are still separating compounds based on their interactions with a stationary phase and a mobile phase. We are still creating a written record of those interactions. The chromatogram is that record.
Understanding why peaks look the way they do, whether clean and symmetrical or distorted and problematic, is central to making chromatography reliable and robust. It is also where thoughtful column design and careful manufacturing make a difference.
From the early experiments of Mikhail Tsvet to modern liquid chromatography platforms using advanced stationary phases, the goal has remained consistent. Produce clear, reliable separations. Generate peaks that reflect true chemistry rather than artifacts. And provide scientists and engineers with data they can trust.
Continuing the Conversation
In a recent interview, YMC America’s Luccas Name described chromatography in simple terms – as “writing with color,” and walked through what makes a good peak and what causes fronting, tailing, and other distortions. His perspective highlights an important point. Peak shape is not just an aesthetic detail. It reflects the quality of the interaction between analyte, stationary phase, and system design.
If you would like to hear that discussion directly, you can watch the full video interview here. It offers a concise overview of chromatograms, peak symmetry, and the practical realities behind the interaction game we play every day in liquid chromatography.